







Non-Isolated DC-DC Topologies
Compare 2-level buck and boost converters against multilevel flying capacitor buck and boost designs, available in 3-level, 4-level and beyond.
Optimal power conversion, found — not guessed.
SOFTWARE OVERVIEW
GT-PowerForge is a power converter design software designed from the ground up to compare a great number of power converter solutions.
Sweeping over a wide range of design parameters, GT-PowerForge will automatically generate hundreds of easy-to-compare power converter solutions.

MODULAR MODEL RESOLUTION
For each explored design option, PowerForge estimates the key converter performance indicators:
These figures not only include semiconductor devices, but also cooling systems and filtering inductors / capacitors. Customizable first-order models are available to estimate the performance of these passive components.

POWER CONVERTER DATABASE
PowerForge offers large libraries of power converter components. It allows you to find the best semiconductor technology and manufacturer for your power converter.
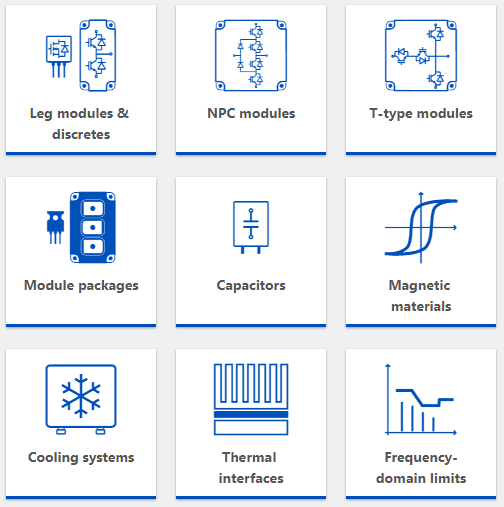
These libraries are assembled from manufacturer-provided data, harmonized in a universal data set enabling a fair comparison across manufacturers and technologies:
AUTOMATED PARAMETER SWEEP
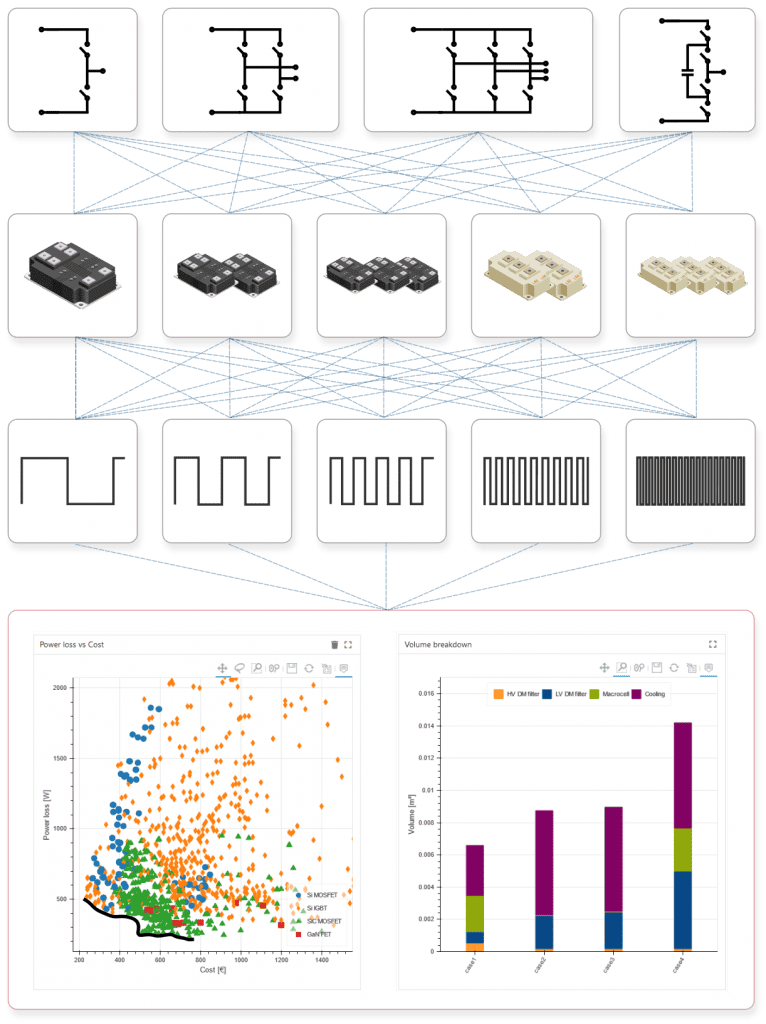
Sweep over many values for all key converter design parameters to explore countless possibilities and reach the optimal design.
Key parameters available for sweeping include:
GT-PowerForge provides comprehensive performance data for each parameter combination, helping engineers to identify the best power converter design solution.
ADVANCED FEATURES
Compare 2-level buck and boost converters against multilevel flying capacitor buck and boost designs, available in 3-level, 4-level and beyond.
Evaluate dual active bridge converters with phase-shift and triangular control, or single active bridge designs built on resonant LLC, CLLC and CLLLC architectures.
Model single-phase 2-level AFE/PFC circuits for grid applications, plus three-phase 2-level, 3-level NPC, 3-level T-Type, Vienna rectifier, and multilevel flying capacitor or stacked multicell AFE designs.
Simulate single-phase 2-level inverters for grid applications alongside three-phase 2-level, 3-level NPC, 3-level T-Type, and multilevel flying capacitor or stacked multicell inverter designs.
Choose from 10 modulation strategies, including sine, third harmonic injection and space vectors, with PD and APOD carrier dispositions for multilevel designs. The choice drives efficiency and THD in medium-voltage motor drives.
Export schematic files with semiconductor loss models to PSIM and PLECS for loss verification and converter control development. Export inductor 2D finite-element models to FEMM for electromagnetic analysis and design fine-tuning.
Generate Excel files covering full solution characteristics (efficiency, cost, power), detailed component-level losses, and efficiency versus output power curves for any chosen device.
Build graphs charting power converter trade-offs, including efficiency versus cost and power density versus cost. Filter results to spot the efficiency-power density Pareto front and compare how total losses and cost break down across semiconductor devices, heatsink and passives.
Connect your own tools to PowerForge through its API: automate sweeps, pull design results into homemade tools, push computed data back into stored designs, and batch-create private components from spreadsheets or data dictionaries.